Robot Framework Dashboard
Robot Framework Dashboard is a powerful tool for analyzing and visualizing test results across multiple Robot Framework runs. It processes output XML files, stores test execution data in a SQLite database, and generates an interactive HTML dashboard. The dashboard utilizes Chart.js, Datatables, and Bootstrap for clear and structured visual representation.
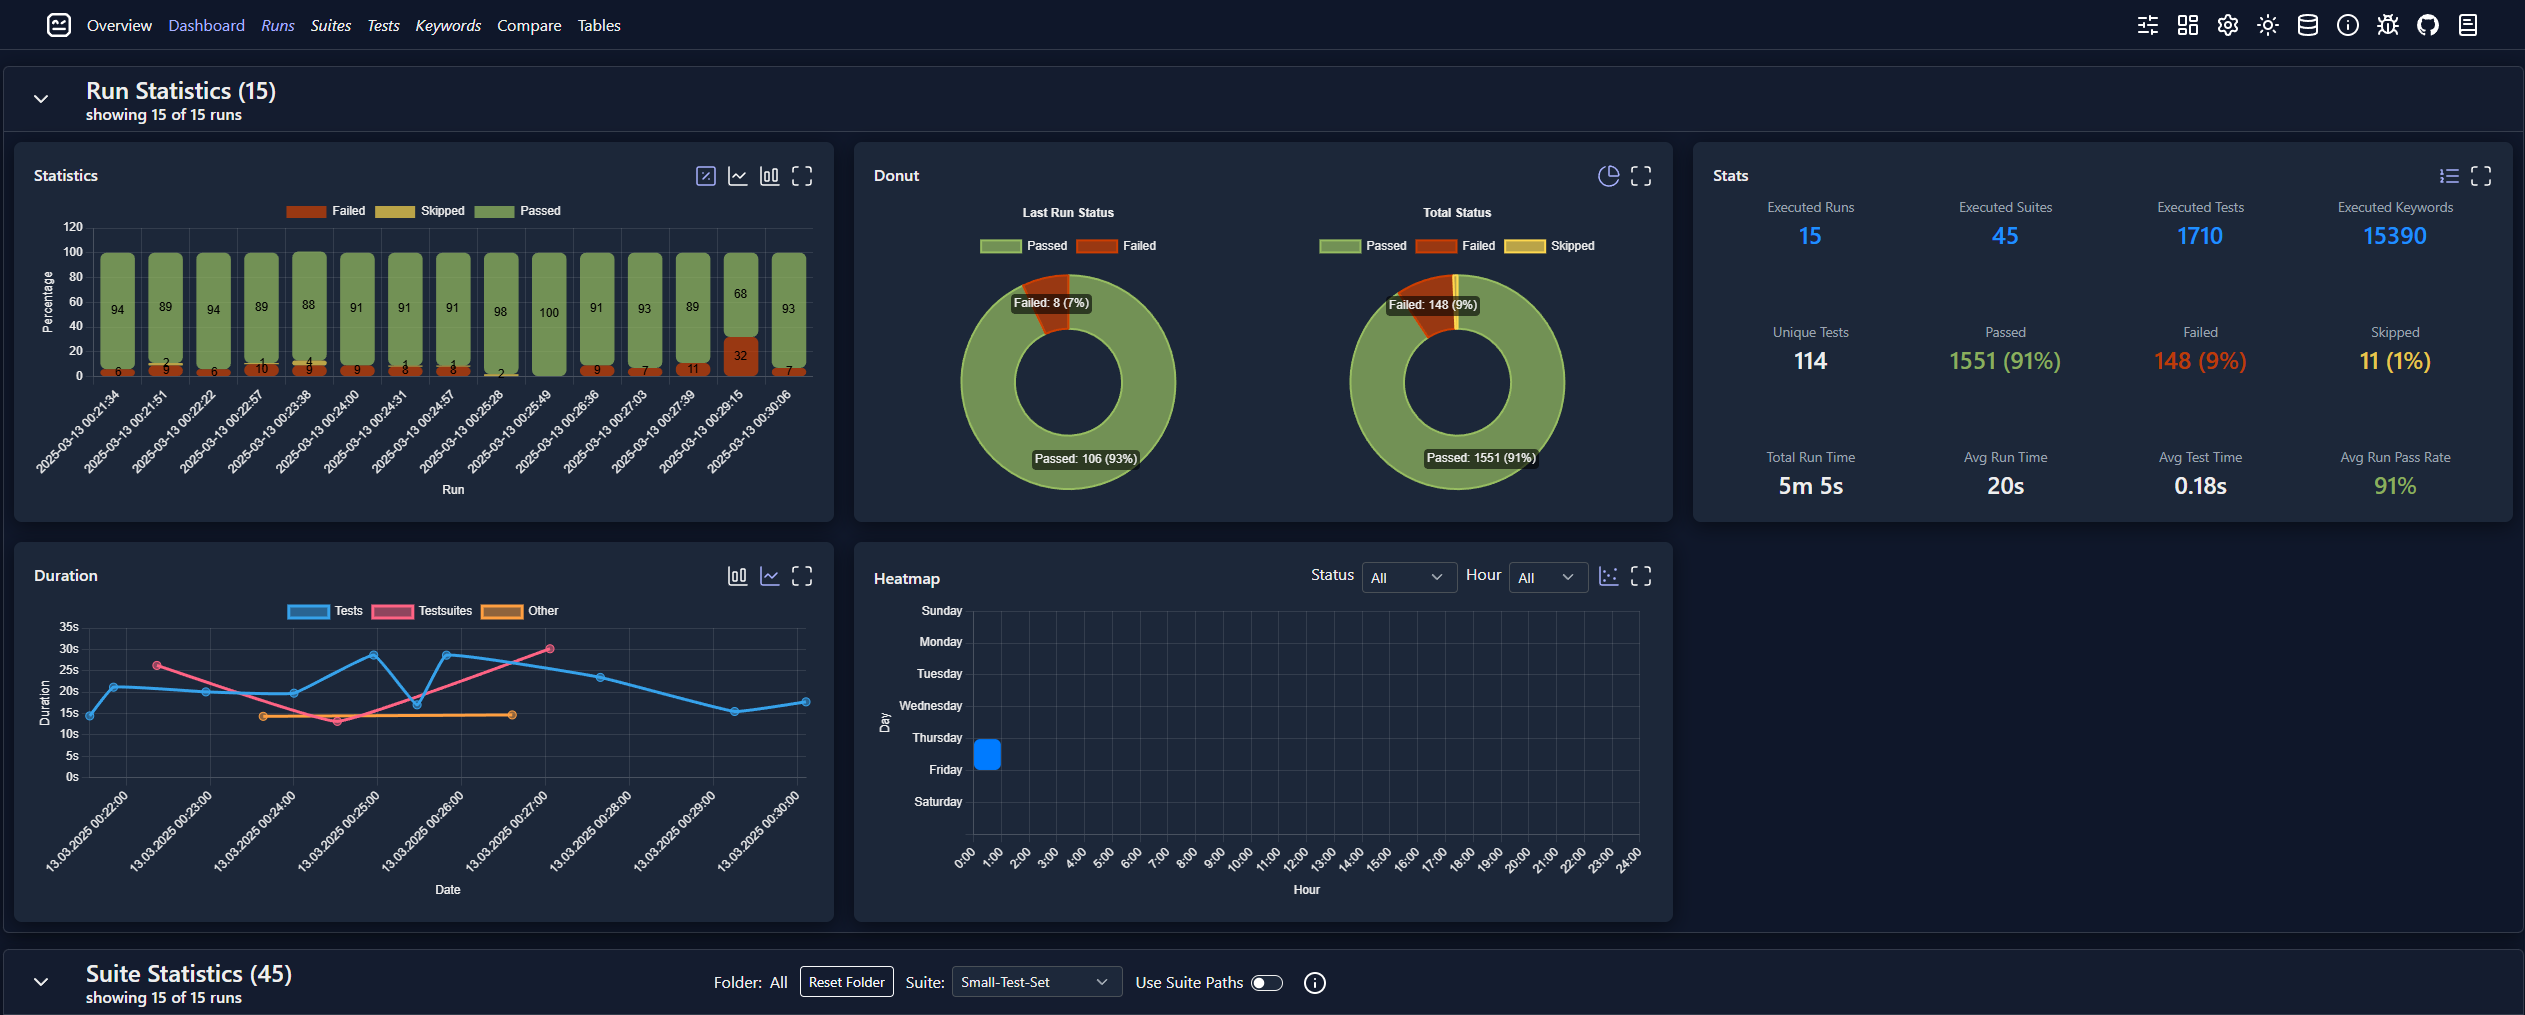
🔍 Key features:
- Multi-run analysis: compare results from multiple runs and track trends over time.
- Interactive dashboard pages: Overview, Dashboard, Compare, suite/test/keyword drilldowns.
- Graphs & tables: pass/fail, duration, status, flaky tests, historical trends, most failed tests.
- Filtering and sorting: run, suite, test, keyword, tags, metadata, date range, and status.
- Comparison mode: side-by-side view of up to 4 runs with delta statistics.
- Log linking: click from dashboard entries to Robot Framework logs (local and server setups).
- Customization: config defaults, layout persistence, graph options, dashboard sections.
- Storage/extendability: SQLite backend plus custom database class support (MySQL/custom).
- Server mode: optional HTTP service that includes an admin page, an API and hosts the dashboard.
- Listener integration: runtime updates via listener to keep dashboard updated after each run.
🚀 Install:
pip install robotframework-dashboard
# for server/listener features
pip install robotframework-dashboard[server]
# or
pip install robotframework-dashboard[all]
📖 Quick links:
🎬 RoboCon Talk
See also my 2025 RoboCon talk, where I explain robotdashboard and its use cases. Note that the UI has improved significantly since then.
📋 Version requirements:
- Robot Framework 6.0+
- Python 3.8+